1. Choose the measurement before choosing the API
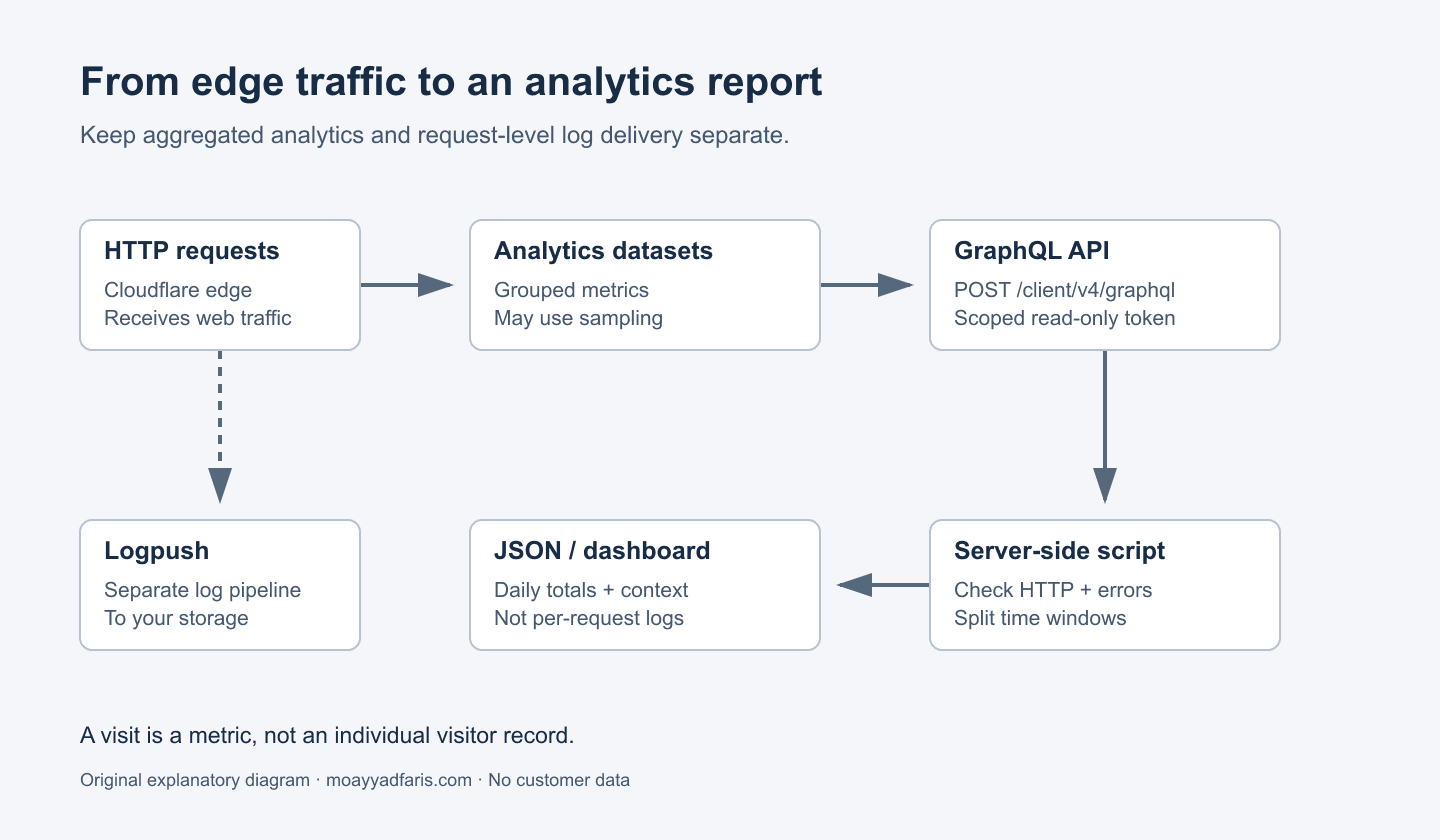
Cloudflare’s GraphQL Analytics API answers questions about traffic passing through its network and other Cloudflare products. Send a JSON POST containing query and variables to https://api.cloudflare.com/client/v4/graphql. Select a dataset, its metrics, and the grouping dimensions you need. The examples here query aggregated HTTP analytics; they are not an export of individual browsing histories. See the API overview.
Start by writing down the question. “Which paths receive the most requests?” is different from “Which pages did one person visit?” A request total includes the traffic selected by the query; it is not automatically a count of people. Cloudflare defines a visit as a page view arriving from a different website or direct link, using the HTTP referrer relative to the hostname. One visit can include several page views. Its high-level page-view definition is a successful HTML response. These definitions do not establish a unique human identity. See metric definitions.
| Tool | What it provides | Best fit | Boundary to remember |
|---|---|---|---|
| GraphQL Analytics | Selected metrics and grouped, potentially sampled results | Trends, traffic breakdowns, repeatable reports | Not a complete request-log archive |
| Logpush | Delivery of log records to a configured destination | Request-level investigation and your own retention pipeline | Configure destination storage and dataset entitlement; Logpush is not storage or search |
| Instant Logs | A live stream of domain traffic | Debugging a change or active incident | Business and Enterprise availability; live inspection rather than a historical archive |
| Web Analytics | Browser-collected analytics and performance metrics | Understanding page experience and navigation | A different collection surface from edge HTTP request datasets |
The Logpush overview, Instant Logs documentation, and Web Analytics collection details explain those distinctions. If the requirement says “raw visit logs,” clarify whether it means HTTP log records or browser navigation events before designing an exporter.
2. Create a scoped read-only token
Use an API token rather than a Global API Key. Cloudflare recommends tokens because permissions and resource scope can be restricted. Open the dashboard’s API token management page, create a custom token, give it a report-specific name, and review the resource selection before saving. The GraphQL token walkthrough explicitly demonstrates Account → Account Analytics → Read.
The permission reference distinguishes account and zone permissions. Account Analytics Read belongs to the account scope; Analytics Read is listed under zone permissions, corresponding to Zone → Analytics → Read in the permission selector. For a single-zone reporting integration, prefer the zone analytics read permission and select only the intended zone. For an account-scoped dataset, use the account analytics read permission with the required account resources. Do not grant edit permissions or select all resources merely to make a failed query disappear. Consult the permission reference alongside the dataset’s requirements.
This guide uses viewer.zones throughout its traffic examples. An account ID is not a replacement for the zone ID in that filter. Conversely, changing the outer node to accounts does not turn a zone-only example into an account query: inspect the datasets and arguments available under that scope first.
Keep CF_API_TOKEN on the server, in a local environment or your scheduler’s secret store. Never embed it in a browser bundle, public repository, screenshot, or shared query payload. The examples put credentials in the Authorization header, not in query variables. Limit resource scope, set an appropriate token lifetime, and rotate credentials through the documented token rolling workflow. Treat IP restrictions as an optional control that must match the exporter’s actual egress address, not as a substitute for read-only scope.
3. Find IDs and discover the limits for your zone
Copy the Zone ID from the domain’s Overview page, in its API section. Copy Account ID there too, or use dashboard search for “Copy account ID.” Cloudflare documents these locations in Find account and zone IDs. The GraphQL names are zoneTag and accountTag; the values are the corresponding IDs, not your domain name, email address, or Web Analytics beacon token.
Before copying a traffic query, inspect the schema and the resource’s settings. Introspection describes field names, types, arguments, and deprecations. Settings describe what the requesting user can actually use for this zone. A field existing in a global schema is not proof that your resource is entitled to query it. The documentation distinguishes these mechanisms in Introspection and Settings node.
Save this as settings.graphql. It checks the adaptive HTTP dataset and the minute rollup used below for page views:
query DatasetSettings($zoneTag: string) { viewer { zones(filter: { zoneTag: $zoneTag }) { settings { httpRequestsAdaptiveGroups { enabled availableFields maxDuration maxPageSize notOlderThan } httpRequests1mGroups { enabled availableFields maxDuration maxPageSize notOlderThan } } } }}Read enabled first. Then record availableFields, maxPageSize, maxDuration, and notOlderThan. The last two describe the query-window width and historical lookback in seconds. They answer different questions: a dataset may retain data older than one allowed query window. Inspect nested field paths in availableFields; do not assume a sibling dataset exposes the same metrics.
Cloudflare also lists httpRequests1hGroups, httpRequests1dGroups, and rumPageloadEventsAdaptiveGroups among its GraphQL datasets. They are alternatives to inspect, not interchangeable names to substitute into this guide. The page-view example deliberately uses the httpRequests1mGroups fields shown in Cloudflare’s migration documentation. If that node is disabled, keep the adaptive visit query and inspect an entitled rollup before adding page views. No universal retention table is assumed here.
4. Send the first query with curl
Save the following operation as first.graphql. Cloudflare’s documented variable scalars include lowercase string for the zone identifier and Time for timestamps. These are schema names, so capitalization matters. JSON serialization escapes the GraphQL document’s newlines correctly; you do not need to flatten a file by hand. This follows the API’s documented query structure and curl request format.
query FirstRequest($zoneTag: string, $start: Time, $end: Time) { viewer { zones(filter: { zoneTag: $zoneTag }) { totals: httpRequestsAdaptiveGroups( limit: 1 filter: { datetime_geq: $start datetime_lt: $end requestSource: "eyeball" } ) { count sum { visits } avg { sampleInterval } } } }}The query omits dimensions, so it asks for a total for the supplied window rather than one result per path or hour. Here count means selected requests. sum.visits means the separate visit metric. avg.sampleInterval provides sampling context; it is not a second traffic count. The requestSource: "eyeball" filter excludes internal Cloudflare product traffic. It does not mean “humans only,” and it does not exclude every bot.
Run the shell block from the directory containing first.graphql. The dates describe one completed UTC day; replace them with a retained interval appropriate to your resource. The token is deliberately absent from request.json.
export CF_ZONE_TAG='<ZONE_TAG>'# Load CF_API_TOKEN securely into this shell; do not paste it into this file.node --input-type=module <<'NODE' > request.jsonimport { readFileSync } from "node:fs";console.log(JSON.stringify({ query: readFileSync("first.graphql", "utf8"), variables: { zoneTag: process.env.CF_ZONE_TAG, start: "2026-11-04T00:00:00Z", end: "2026-11-05T00:00:00Z" }}));NODEcurl --silent --show-error \ 'https://api.cloudflare.com/client/v4/graphql' \ --header "Authorization: Bearer $CF_API_TOKEN" \ --header 'Content-Type: application/json' \ --data-binary @request.jsonInspect both the HTTP outcome and the response’s errors member. HTTP 200 alone is insufficient to declare success. Check that exactly the intended zone was returned before reading its metrics. If no zone is returned, investigate the identifier and token resource scope instead of converting the result into a zero-traffic report. The error response documentation explicitly describes application errors inside successful HTTP responses; the TypeScript exporter below enforces that rule.
5. Retrieve daily visits and page views without mixing them
Save this operation as daily.graphql. Execute it once for each UTC day in your requested date range, or for smaller nonoverlapping pieces when settings require them. It intentionally uses two datasets rather than inventing a pageViews field on the adaptive visit aggregate.
query DailyTotals($zoneTag: string, $start: Time, $end: Time) { viewer { zones(filter: { zoneTag: $zoneTag }) { visits: httpRequestsAdaptiveGroups( limit: 1 filter: { datetime_geq: $start datetime_lt: $end requestSource: "eyeball" } ) { sum { visits } avg { sampleInterval } } pageViews: httpRequests1mGroups( limit: 1 filter: { datetime_geq: $start, datetime_lt: $end } ) { sum { pageViews } } } }}Cloudflare documents adaptive sum.visits and avg.sampleInterval in its HTTP dataset migration guide; the separate Zone Analytics migration example exposes rollup sum.pageViews. Selecting no time dimension returns a period total. The exporter labels that period with the UTC date it requested, avoiding an assumption about a daily dimension on another node.
Keep the column definitions visible in the output. Visits here use the adaptive dataset with requestSource=eyeball. Page views use a zone-wide rollup, without claiming that it accepts the same filter. These are not identical request populations, so do not calculate a “human conversion rate” by dividing one column by the other. If a report needs identical populations, first find a dataset and filtering policy that support that requirement.
Use half-open windows: include the start with datetime_geq, exclude the end with datetime_lt. November 4 runs from midnight November 4 up to, but not including, midnight November 5. The next interval starts at exactly that boundary. Adjacent windows then avoid double counting boundary timestamps. Cloudflare’s filtering documentation also notes that time filters use event start timestamps.
This is a date-range workflow, not a claim that every plan accepts a full day in one request. The exporter computes a permitted chunk size from both nodes’ settings, adds returned totals into daily rows, and preserves missing groups as null rather than silently inventing zero observations. It exports the two metric definitions with the data so downstream charts retain that context.
6. Rank paths, countries, and user agents deliberately
Save this operation as top.graphql. The path and user-agent aliases rank successful or redirected client requests using the same half-open window. Status filters select 200 through 399. They do not redefine the result as page views: a successful image or script request is still an HTTP request.
query TopTraffic($zoneTag: string, $start: Time, $end: Time) { viewer { zones(filter: { zoneTag: $zoneTag }) { paths: httpRequestsAdaptiveGroups( limit: 10 orderBy: [count_DESC] filter: { datetime_geq: $start, datetime_lt: $end requestSource: "eyeball" edgeResponseStatus_geq: 200, edgeResponseStatus_lt: 400 } ) { count dimensions { clientRequestPath } } agents: httpRequestsAdaptiveGroups( limit: 10 orderBy: [count_DESC] filter: { datetime_geq: $start, datetime_lt: $end requestSource: "eyeball" edgeResponseStatus_geq: 200, edgeResponseStatus_lt: 400 } ) { count dimensions { userAgent } } countries: httpRequests1mGroups( limit: 1 filter: { datetime_geq: $start, datetime_lt: $end } ) { sum { countryMap { clientCountryName requests } } } } }}The path aggregate returns count and dimensions.clientRequestPath; adding further dimensions would change each row’s grouping. Keep the question narrow before expanding it to combinations of path, country, status, and browser. Cloudflare’s hostname and path tutorial demonstrates path dimensions, and its AI Crawl Control GraphQL reference documents user-agent dimensions and status-range filters.
The country result intentionally follows the documented rollup sum.countryMap shape. Its members contain clientCountryName and requests; they are not a separate top-level GraphQL collection. Order that returned map in your application and take the desired number of entries. Cloudflare’s sorting documentation says ordering inside nested structures is not supported.
function topCountries(zone) { return (zone.countries[0]?.sum.countryMap ?? []) .slice() .sort((a, b) => b.requests - a.requests) .slice(0, 10);}The country rollup is zone-wide and does not share the path query’s status and source filters. Label the resulting panels accordingly. For a like-for-like country breakdown, inspect the adaptive country dimension in your schema and apply the same filters; do not present these differently scoped panels as reconciled totals.
User agents can be spoofed. A recognizable crawler name is useful for exploration, not identity verification or a complete bot exclusion rule. This guide therefore uses documented status filtering rather than inventing a bot-score threshold or promising paid Bot Management fields on every plan. The value 10 is a chosen top-list size, not Cloudflare’s maximum page size.
7. Export a date range with a typed Node script
The following exporter reads settings.graphql and daily.graphql, checks availability and retention, and writes a JSON report. Save it as export.ts. Use a Node release that supports built-in fetch and TypeScript type stripping; the local checks for this guide used Node 22.12 with the explicit experimental flag shown below.
import { readFile } from "node:fs/promises";type Variables = { zoneTag: string; start?: string; end?: string };type Envelope<T> = { data?: T | null; errors?: { message: string; path?: (string | number)[] }[] | null;};type Scope<T> = { viewer: { zones: T[] } };type NodeSettings = { enabled: boolean; maxDuration: number; maxPageSize: number; notOlderThan: number; availableFields: string[];};type Settings = { settings: { httpRequestsAdaptiveGroups: NodeSettings; httpRequests1mGroups: NodeSettings;} };type Totals = { visits: { sum: { visits: number }; avg: { sampleInterval: number } }[]; pageViews: { sum: { pageViews: number } }[];};const endpoint = "https://api.cloudflare.com/client/v4/graphql";export async function request<T>( token: string, query: string, variables: Variables, transport: typeof fetch = fetch,): Promise<T> { const response = await transport(endpoint, { method: "POST", headers: { Authorization: `Bearer ${token}`, "Content-Type": "application/json" }, body: JSON.stringify({ query, variables }), signal: AbortSignal.timeout(30_000), }); const body = await response.text(); let result: Envelope<T>; try { result = JSON.parse(body) as Envelope<T>; } catch { throw new Error(`Non-JSON response; HTTP ${response.status}`); } if (!response.ok || (result.errors?.length ?? 0) > 0) { const details = result.errors?.map(e => e.message).join("; ") || "Request failed"; throw new Error(`HTTP ${response.status}: ${details}`); } if (result.data == null) throw new Error("Response has no data"); return result.data;}export function oneZone<T>(data: Scope<T>): T { if (!Array.isArray(data.viewer?.zones) || data.viewer.zones.length !== 1) throw new Error("Expected one zone: check zone ID and token scope"); return data.viewer.zones[0];}export function utcDay(value: string): number { const time = Date.parse(`${value}T00:00:00Z`); if (!/^\d{4}-\d{2}-\d{2}$/.test(value) || !Number.isFinite(time) || new Date(time).toISOString().slice(0, 10) !== value) throw new Error("Expected a valid YYYY-MM-DD date"); return time;}export function checkedNumber(value: unknown): number { if (typeof value !== "number" || !Number.isFinite(value) || value < 0) throw new Error("Invalid numeric metric"); return value;}export async function main() { const token = process.env.CF_API_TOKEN; const zoneTag = process.env.CF_ZONE_TAG; if (!token || !zoneTag) throw new Error("Set CF_API_TOKEN and CF_ZONE_TAG"); const [startArg, endArg] = process.argv.slice(2); if (!startArg || !endArg) throw new Error("Supply start and exclusive end dates"); const start = utcDay(startArg), end = utcDay(endArg), now = Date.now(); const dayMs = 86_400_000; const today = Math.floor(now / dayMs) * dayMs; if (end <= start || end > today) throw new Error("Choose completed UTC days"); const settingsQuery = await readFile("settings.graphql", "utf8"); const dailyQuery = await readFile("daily.graphql", "utf8"); const { settings } = oneZone(await request<Scope<Settings>>( token, settingsQuery, { zoneTag }, )); const nodes = [settings.httpRequestsAdaptiveGroups, settings.httpRequests1mGroups]; for (const node of nodes) { if (!node?.enabled || node.maxPageSize < 1 || !Number.isFinite(node.maxDuration) || node.maxDuration < 1 || !Number.isFinite(node.notOlderThan) || node.notOlderThan < 1) throw new Error("Dataset unavailable or limits unusable; inspect settings"); if (start < now - node.notOlderThan * 1000) throw new Error("Start is outside a dataset's retention"); } const chunkMs = Math.floor(Math.min(...nodes.map(n => n.maxDuration), 86_400)) * 1000; const rows: { day: string; visits: number | null; pageViews: number | null; chunkAverageSampleIntervals: number[] }[] = []; for (let day = start; day < end; day += dayMs) { let visits = 0, pageViews = 0, visitsMissing = false, viewsMissing = false; const intervals: number[] = []; for (let from = day; from < day + dayMs; from += chunkMs) { const to = Math.min(from + chunkMs, day + dayMs); const data = oneZone(await request<Scope<Totals>>(token, dailyQuery, { zoneTag, start: new Date(from).toISOString(), end: new Date(to).toISOString(), })); if (!Array.isArray(data.visits) || !Array.isArray(data.pageViews) || data.visits.length > 1 || data.pageViews.length > 1) throw new Error("Unexpected aggregate shape"); const visit = data.visits[0], view = data.pageViews[0]; if (visit) { visits += checkedNumber(visit.sum.visits); intervals.push(checkedNumber(visit.avg.sampleInterval)); } else visitsMissing = true; if (view) pageViews += checkedNumber(view.sum.pageViews); else viewsMissing = true; // Application pacing policy, not a guarantee against shared-budget throttling. await new Promise(resolve => setTimeout(resolve, 1000)); } rows.push({ day: new Date(day).toISOString().slice(0, 10), visits: visitsMissing ? null : visits, pageViews: viewsMissing ? null : pageViews, chunkAverageSampleIntervals: intervals }); } console.log(JSON.stringify({ zoneTag, start: startArg, endExclusive: endArg, visitsDataset: "httpRequestsAdaptiveGroups; requestSource=eyeball", pageViewsDataset: "httpRequests1mGroups; zone-wide", rows }, null, 2));}if (process.argv[1]?.endsWith("export.ts")) { main().catch(error => { console.error(error instanceof Error ? error.message : String(error)); process.exitCode = 1; });}The transport function treats a nonempty GraphQL errors array as failure even when HTTP is successful. It also rejects a missing data envelope and unexpected zone cardinality. TypeScript interfaces document the expected shape, while the numeric and array checks catch malformed metric responses before totals are emitted. These checks are application safeguards, not a substitute for introspecting the actual API schema.
The exporter only accepts completed UTC days. It calculates the smaller allowed query duration across its two datasets, caps each chunk at a day boundary, and keeps the end exclusive. It records each chunk’s average sampling interval as context rather than averaging those averages into a supposedly authoritative sampling rate for the whole day. Missing groups propagate to a null daily metric; consumers must decide how to display that condition.
export CF_ZONE_TAG='<ZONE_TAG>'# CF_API_TOKEN must already be set securely.node --experimental-strip-types export.ts 2026-11-01 2026-11-05 > report.jsonRedirect output to a temporary file in scheduled jobs, then move it into place only after a successful exit. That prevents a failed run from replacing yesterday’s valid report with an empty file. Keep logs, response errors, and credentials separate from the report artifact, and restrict access to all traffic exports. No illustrative traffic totals are included here: the examples were checked locally against documented field shapes, not run against a customer zone.
8. Separate pagination, chunking, and rate budgets
Cloudflare’s limits documentation states that a zone-scoped query can include up to 10 zones, while an account-scoped query can include one account. The default user quota is 300 GraphQL queries over a five-minute window, in addition to general API limits. Do not assume that making a new token supplies a new independent budget for a shared user.
Dataset limits are resource-specific. Essential adaptive datasets, including httpRequestsAdaptiveGroups, are available across plans, and the limits page says adaptive datasets retain at least 31 days on every plan. That does not mean every adaptive query may span 31 days, and it says nothing universal about a rollup’s retention. Read notOlderThan and maxDuration separately for every participating node.
Cloudflare does not support cursor pagination here. Its documented mechanism combines limit, orderBy, and filters. For a dimension export, use an explicitly ordered, stable grouping key and advance the corresponding boundary; where several fields define the group, design a lexicographic continuation condition for the complete key. Do not add an after cursor from an unrelated GraphQL API. See Pagination.
Time chunking solves a different problem: it bounds query duration. A top-10 path list from every chunk cannot be summed into a guaranteed top-10 list for the whole range, because a path missing every local shortlist may still matter globally. Use a complete grouping export or query the full permitted range for its own top list. The daily totals query has no dimensions and requests one aggregate, so it avoids dimension pagination altogether.
The script’s one-second delay is a conservative application policy, not a promise that a shared budget cannot throttle it. Coordinate concurrent jobs and back off on 429 responses. Cloudflare also documents opt-in account-based rate limiting using X-Rate-Limit-Type: account-based; inspect that model’s resource-scoping requirements before adding the header to a multi-zone exporter.
9. Interpret sampling and reconcile dashboard differences
Adaptive datasets can return estimates derived from sampled observations. Cloudflare already extrapolates reported analytics metrics; do not multiply count or sum.visits by sampleInterval again. Save the interval as provenance for the estimate. Its presence does not turn an aggregate into a complete set of underlying request records. The sampling documentation explains that the sampling rate adjusts automatically rather than being a client-controlled completeness switch.
Repeated identical queries can vary because Adaptive Bit Rate sampling can select different resolutions. Cloudflare recommends shorter intervals and grouped datasets to reduce that variation; rare events may be missed by sampling. The inconsistent-results FAQ describes these limits. Store the query text, variables, dataset names, extraction time, and token scope category with important reports so a later investigation can reproduce the measurement definition without retaining the secret.
Before comparing with a dashboard, align the selected zone, hostname, UTC boundaries, source filter, status filter, and metric definition. Also check whether the dashboard is showing edge traffic or Web Analytics. Browser beacon collection and edge request aggregation are different observation points. A mismatch between those surfaces is not, by itself, proof that the exporter dropped rows.
Standard Google Analytics executes its tracking code in the browser, according to Cloudflare’s Google Analytics integration documentation. It is therefore not another name for the same edge request dataset. Compare like metrics from known collection surfaces before diagnosing differences as sampling error. If a business report requires a unique-user or session definition, document that definition independently; this guide’s visit total does not supply it.
Treat reconciliation as an experiment: start with one completed UTC day, remove optional filters, compare the same dataset in the dashboard, then reintroduce filters individually. Keep the initial report and each query revision. This workflow separates collection differences from grouping mistakes without forcing unrelated analytics products to agree numerically.
10. Troubleshoot failures and schedule a reliable report
Start troubleshooting at the layer that failed. Cloudflare’s error reference documents authentication, authorization, parsing, dataset-limit, rate-limit, and temporary service failures. Retrying a bad field name cannot fix a schema mismatch, while granting broader permissions cannot fix an expired token.
| Symptom | Check first | Corrective action |
|---|---|---|
HTTP 401 or Unauthorized | Authorization header and token validity | Load the intended token; replace or rotate an invalid credential |
| HTTP 403 | Permission and resource selection | Match the required analytics read permission to the specific zone or account |
| Empty zone result or a zone-selection failure | Zone ID versus account ID and token scope | Recopy the zone identifier and confirm access; do not export a zero total |
query time range is too large... | Dataset maxDuration | Split into smaller half-open windows |
| Historical range rejected | Dataset notOlderThan | Move within retention; chunking cannot recover expired data |
unknown field... | Current schema, node, capitalization and deprecation | Introspect and select a documented, entitled field |
| HTTP 200 with nonempty errors | GraphQL response envelope | Fail the job and preserve the error context |
| HTTP 429 or temporary 503 | Rate budget, concurrency and service status | Back off and reduce pressure; avoid immediate retry storms |
Treat “zone not found” as a troubleshooting description here, not a promised literal Cloudflare error string. Keep the returned message and error path available to operators, but redact tokens and any sensitive variables before sharing diagnostics. An error affecting one requested dataset should not quietly produce a polished report with the other metric missing.
For scheduling, use a server-side scheduler or CI job that injects the token as a secret. Query completed days, prevent overlapping runs, and promote a report only after successful completion. Record a checkpoint after the artifact is saved; retrying the same logical interval should replace its prior artifact rather than append another copy. If your retention requirement exceeds the API’s lookback, schedule extraction early enough to preserve your own aggregates, or select an entitled log-delivery pipeline for request-level records. A scheduler cannot recreate data that the API no longer retains.